
Real estate agents reported significant slippage in their November buyer pipelines as new economic indicators suggested consumers are souring on their job security.
These were the preliminary takeaways from Intel’s Client Pipeline Tracker, a measure of agent sentiment toward their present and future business prospects.
While some of the decline in the score was due to an elevated level of responses by indie and lower-volume agents in the ongoing Intel Index survey, an Intel analysis suggests that the observation of thinning pipelines holds up even after accounting for shifts in response demographics.
And while the trend is not showing up yet in sales, it may — if it holds up — present revenue headwinds for brokerages in December and January further down the pipeline.
Client Pipeline Tracker score in November: -6
- Previous score: +2 in October
- Recent high point: +5 in August
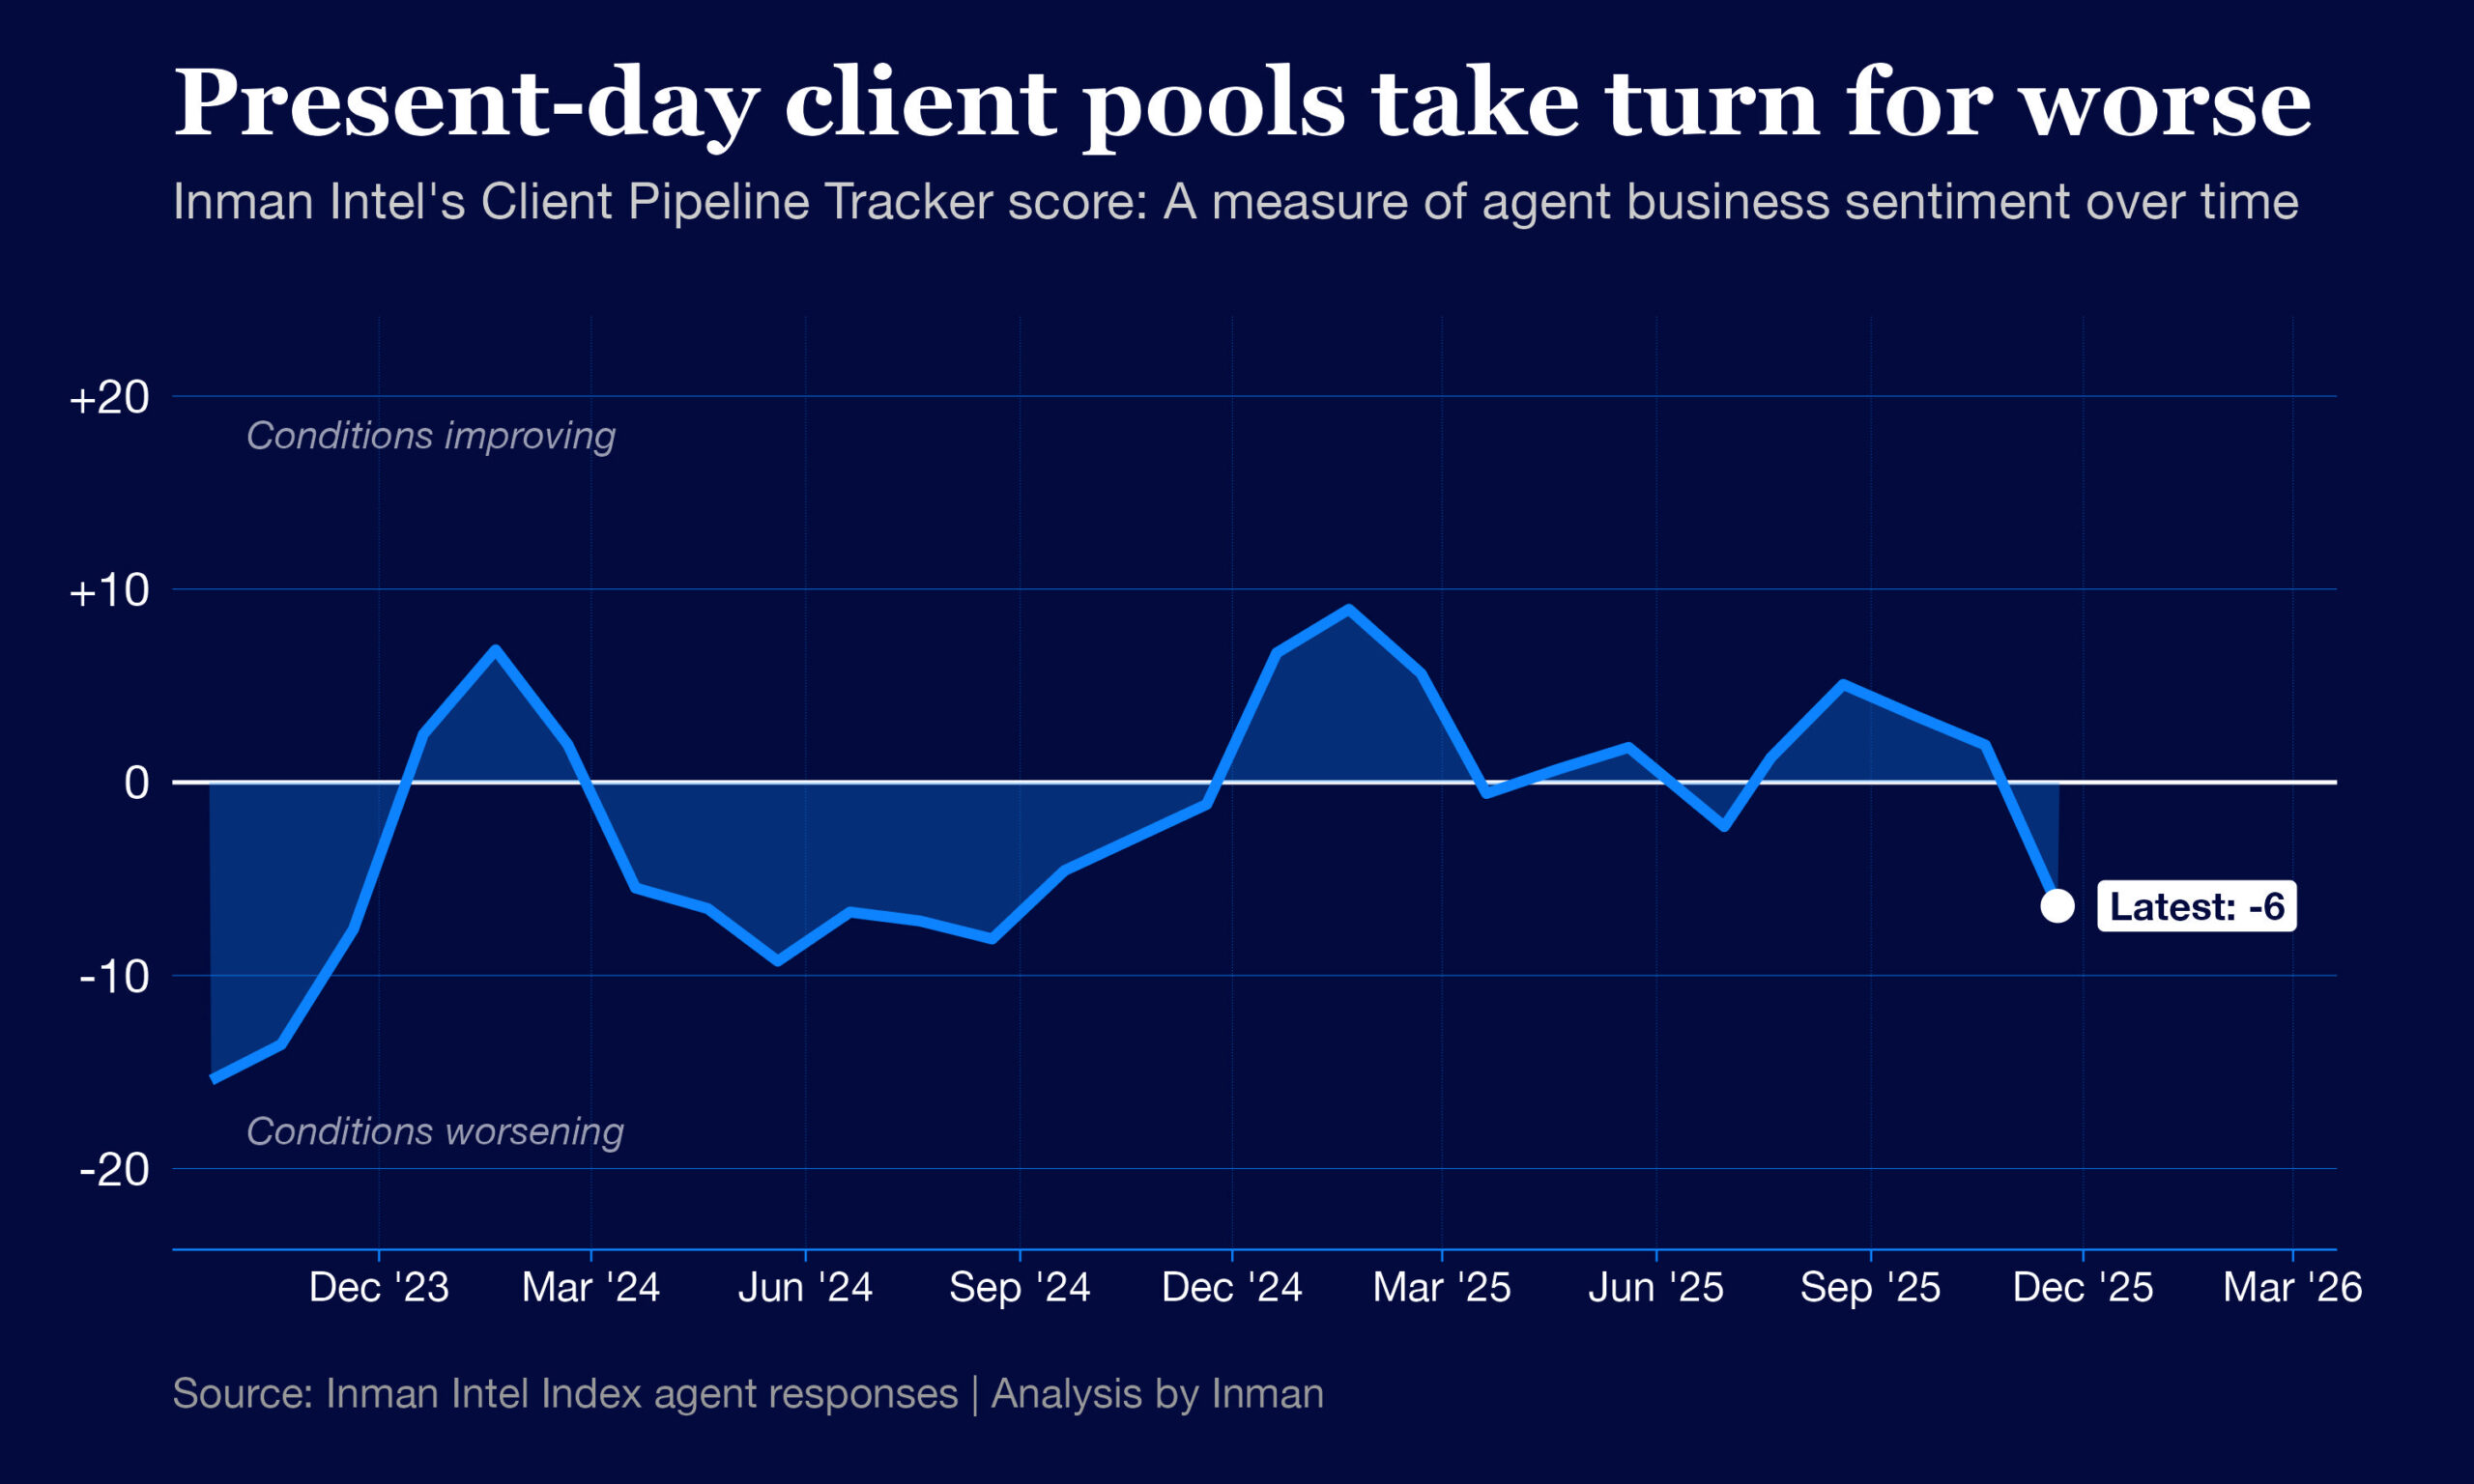
Chart by Daniel Houston
The score is holding in a neutral range because agents have yet to meaningfully downgrade their outlooks for the year ahead, especially on the listing side.
But there are signs that early conversations with clients have taken a turn. In the full report, Intel breaks down the survey components and the economic data that may help explain this shift.
Validating a trend
Intel’s Client Pipeline Tracker is a compilation of how agents feel about their buyer and seller pipelines — both over the past year and in the near future.
Intel described the methodology in this post, but here’s a quick refresher on how to interpret the scores.
- A score of 0 represents a neutral period in which client pipelines are neither improving nor worsening.
- A positive score reflects a market in which client pipelines have been improving, or are widely expected to improve in the next 12 months. The higher the rating, the more confident agents are in that conditions are moving in a positive direction.
- A negative score suggests client pipeline conditions are worsening, or are widely expected to get worse in the year to come.
An extremely positive combined score falls somewhere around the +20 mark. This type of score would signify that much of the industry is in agreement that pipelines are improving and will continue to improve.
An extremely negative combined score, on the other hand, falls closer to -20. That’s a bit lower than where the industry stood in September 2024, the first time Intel surveyed agents about their pipelines.
For each of the four individual components that go into the score, results as high as +50 or as low as -50 are sometimes observed.
Here are the component scores from the most recent survey, and how each sentiment category changed from the previous one.
Tracker component scores
October → November
- Present buyer pipelines: -26 → -46
- Future buyer pipelines: +12 → +3
- Present seller pipelines: -9 → -21
- Future seller pipelines: +11 → +11
The drop is stark — particularly in the present-day conditions reported by agents.
- 35 percent of agent respondents reported buyer pipelines were “significantly” thinner in November than at the same time last year, a jump from 22 percent who said the same in October.
- Perhaps just as notably, the share of agent respondents who told Intel their pipelines improved year-over-year fell to 6 percent in November — from 16 percent the previous month.
A similar pattern was observed on the listing side.
- The share of agent respondents who reported their listing pipelines were lighter year-over-year rose to 46 percent in November, up from 36 percent the previous month.
Despite this, expectations for the future held relatively steady, suggesting that most agents weren’t too concerned about the long-term prospects for their business.
Since Intel’s Client Pipeline Tracker metric gives future expectations more weight than present-day conditions, the overall score remains pretty close to neutral after the reported shift.
Still, with reported changes this dramatic, and no obvious event to explain it, Intel wanted to confirm that this was an actual trend worth following, and not an artifact of the survey itself.
As of Wednesday, when the Tracker was last updated, Intel did note a few response populations that participated at different rates than normal.
Here are the ones that stand out most:
- Agents who conducted 10 transactions or fewer over the past 12 months accounted for 61 percent of responses in November’s survey. Typically, this group accounts for just under half of agent responses.
- In November, 42 percent of all agent respondents hailed from private indie brokerages, vs. 58 percent from franchises or publicly traded non-franchising companies. That’s a bit elevated from a typical month’s indie response share, which is usually in the mid-to-high 30s.
- Agents who responded to November’s survey were noticeably more likely to work in the South, and less likely to work in the Northeast. This swing accounted for 6 percent of all responses.
These subtle differences in the makeup of agents responding to the survey undoubtedly contributed to a few points of the apparent decline in agent sentiment.
That said, when looking under the hood, Intel confirmed that each of these groups — especially indies and lower-volume agents — saw reductions in sentiment even when looking only at their group over time.
And to a lesser extent, the trend was visible among higher-volume agents and agents in bigger brokerage networks as well.
A shutdown blip?
It would be premature to conclude from this one survey that pipelines are in the early stages of drying up. Even the agents Intel surveyed in November don’t seem to expect it to last.
But some new private-sector economic data may shed light on how the tone of conversations with clients is changing.
Consumer perceptions of their own financial situations declined in November to the lowest level since August 2024, and their perceptions of the labor market worsened, according to the Conference Board’s Consumer Confidence Survey results released Tuesday.
These survey respondents increasingly cited factors related to the national economy, including inflation, tariffs and worries over the since-ended federal government shutdown, Chief Economist Dana Peterson said in the Conference Board report.
The shutdown also disrupted the release of some federal jobs numbers that we might normally employ to help make sense of numbers like this. But privately compiled jobs data suggest that layoffs might be ticking up.
ADP’s weekly payroll report estimates that U.S. employers shed jobs at a rate of 13,500 a week during the four-week period ending Nov. 8, perhaps adding to concerns among clients that their jobs might be less secure.
Like any survey result, we’ll need to see if it holds up over a multi-month period before drawing big conclusions. But for now, the weak numbers are worth keeping an eye on as real estate turns the page to winter.
Methodology notes: This month’s Inman Intel Index survey was set to run from Nov. 20-Dec. 3, 2025, and had received 320 responses by the Thanksgiving holiday. These results are preliminary and may be revised. The entire Inman reader community was invited to participate, and a rotating, randomized selection of community members was prompted to participate by email. Users responded to a series of questions related to their self-identified corner of the real estate industry — including real estate agents, brokerage leaders, lenders and proptech entrepreneurs. Results reflect the opinions of the engaged Inman community, which may not always match those of the broader real estate industry. This survey is conducted monthly.
Email Daniel Houston